Category Trends Analysis
The Category Trends page allows brand managers and market analysts to evaluate the macroeconomic movements of product departments and sub-categories. By utilizing precision filtering and sorting tools, you can easily isolate high-growth categories, evaluate average pricing structures, and identify the leading brands driving your revenue.
1. Global Filter Framework
At the top of the dashboard, you can isolate your target market data using three specific control parameters. This allows you to cut through global noise and focus on exact performance vectors.
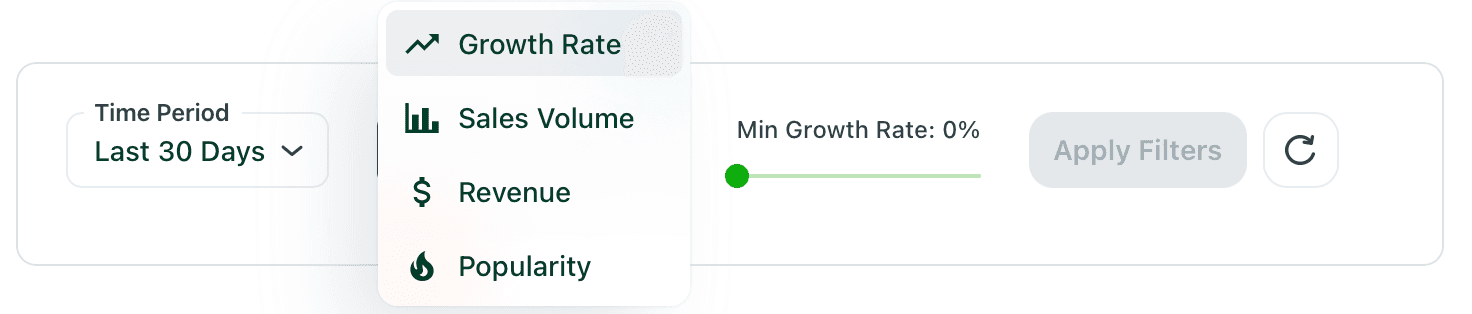
A. Time Period
Filter the historical data window to identify short-term spikes or long-term structural consumer shifts:
- Past Week: Ideal for monitoring rapid reactions to recent marketing campaigns or holiday rushes.
- Last Month: Best for standard monthly performance audits.
- 3 Months: Provides a clean quarterly view to account for seasonal variations.
- Full Year: Offers a year-over-year macro view of long-term department stability.
B. Sort By Options
Organize your sub-category rankings based on your immediate operational priorities:
- Growth Rate: Ranks categories by their percentage acceleration in sales over the selected period. Perfect for finding sudden trend shifts.
- Sales Volume: Ranks items purely by the physical quantity of units sold, helping you identify high-velocity stock turners.
- Revenue: Sorts by absolute gross financial generation. This highlights the categories anchoring your actual cash flow.
- Popularity: A blended metric that combines consumer impressions, search clicks, and cart additions to measure overall engagement.
C. Minimum Growth Rate Slider
For maximum specificity, use the interactive slider (0% to 100%) to filter out stagnant or declining categories. Adjusting this slider instantly removes any sub-category whose growth percentage falls below your chosen threshold, leaving you with a highly refined list of trending sectors.
2. Sub-Category Performance Breakdowns
Based on the filters defined above, the dashboard generates a dynamic list of your sub-categories.
Every entry prominently displays its Numerical Percentage Growth Value right at the header level (e.g., +42.0% Growth), followed by a deep-dive operational matrix.
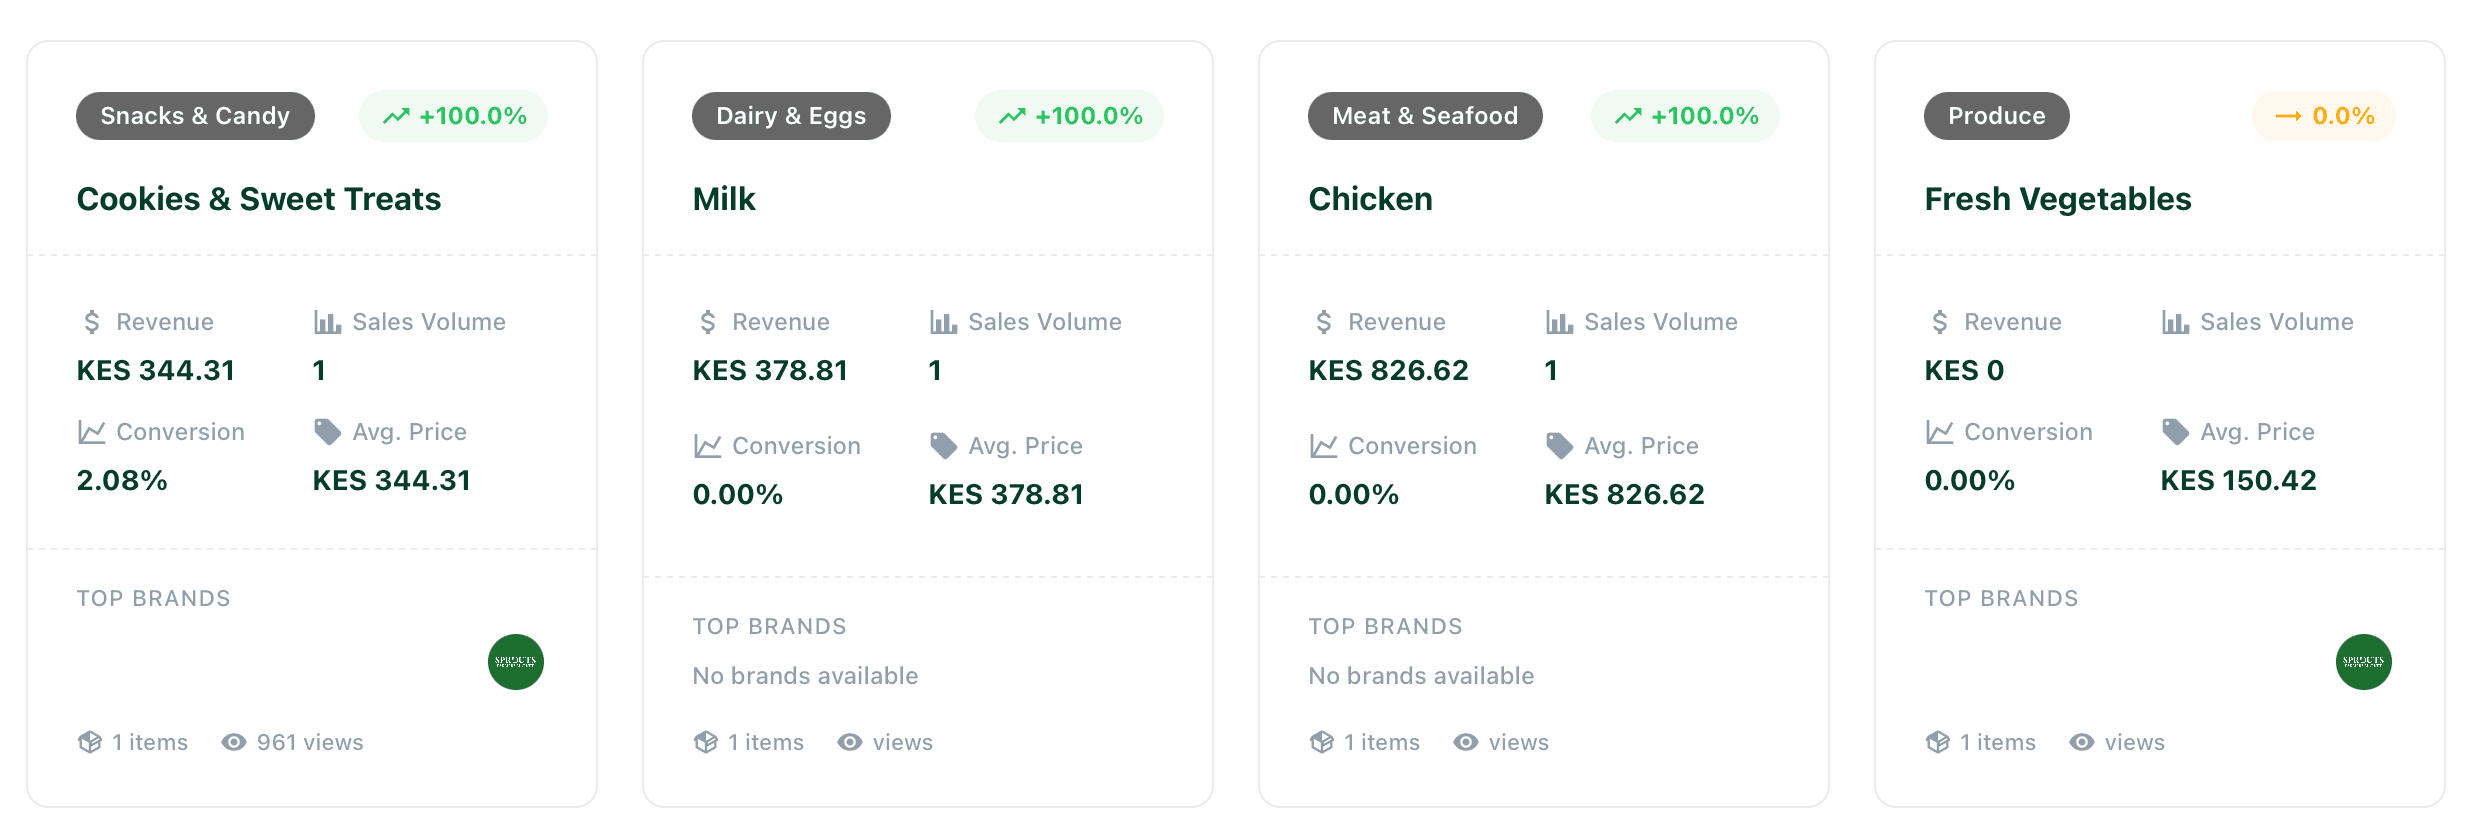
Core Performance Metrics
For every individual sub-category listed, the platform records and displays four foundational points of data:
- 💲 Revenue: The absolute gross monetary value generated by all item sales within this specific sub-category.
- 📊 Sales Volume: The physical unit count of items successfully purchased by consumers.
- 📈 Conversion Percentage: The ratio of unique customer impressions on this sub-category that successfully resulted in a finalized checkout.
- 🏷️ Average Price: The average unit price of products bought in that sub-category.
Brand Leadership Insights
Directly below the core numeric metrics, the dashboard lists the Top Brands generating the highest sales velocity within that specific sub-category.
This gives your merchandising team instant clarity on whether a category’s growth is being driven by a single dominant supplier or a healthy mix of competing brand names, making it a vital asset when preparing for upcoming supplier contract renegotiations.