Sales Reporting
The Sales Reporting dashboard provides a real-time pulse on your store’s financial health. By aggregating transactional data into digestible daily and weekly views, Instagrocer allows you to track growth trends and monitor performance against historical benchmarks.
Accessing Sales Reports
You can access these insights in two ways:
- Global View: Navigate to the Reporting tab from your main dashboard to see aggregated data.
- Location-Specific View: Select a specific store from the Home tab to view the same metrics filtered exclusively for that location.
Core Performance Modules
The reporting page is divided into two primary sections, each designed to provide context through direct comparison.
1. Today’s Performance (Daily View)
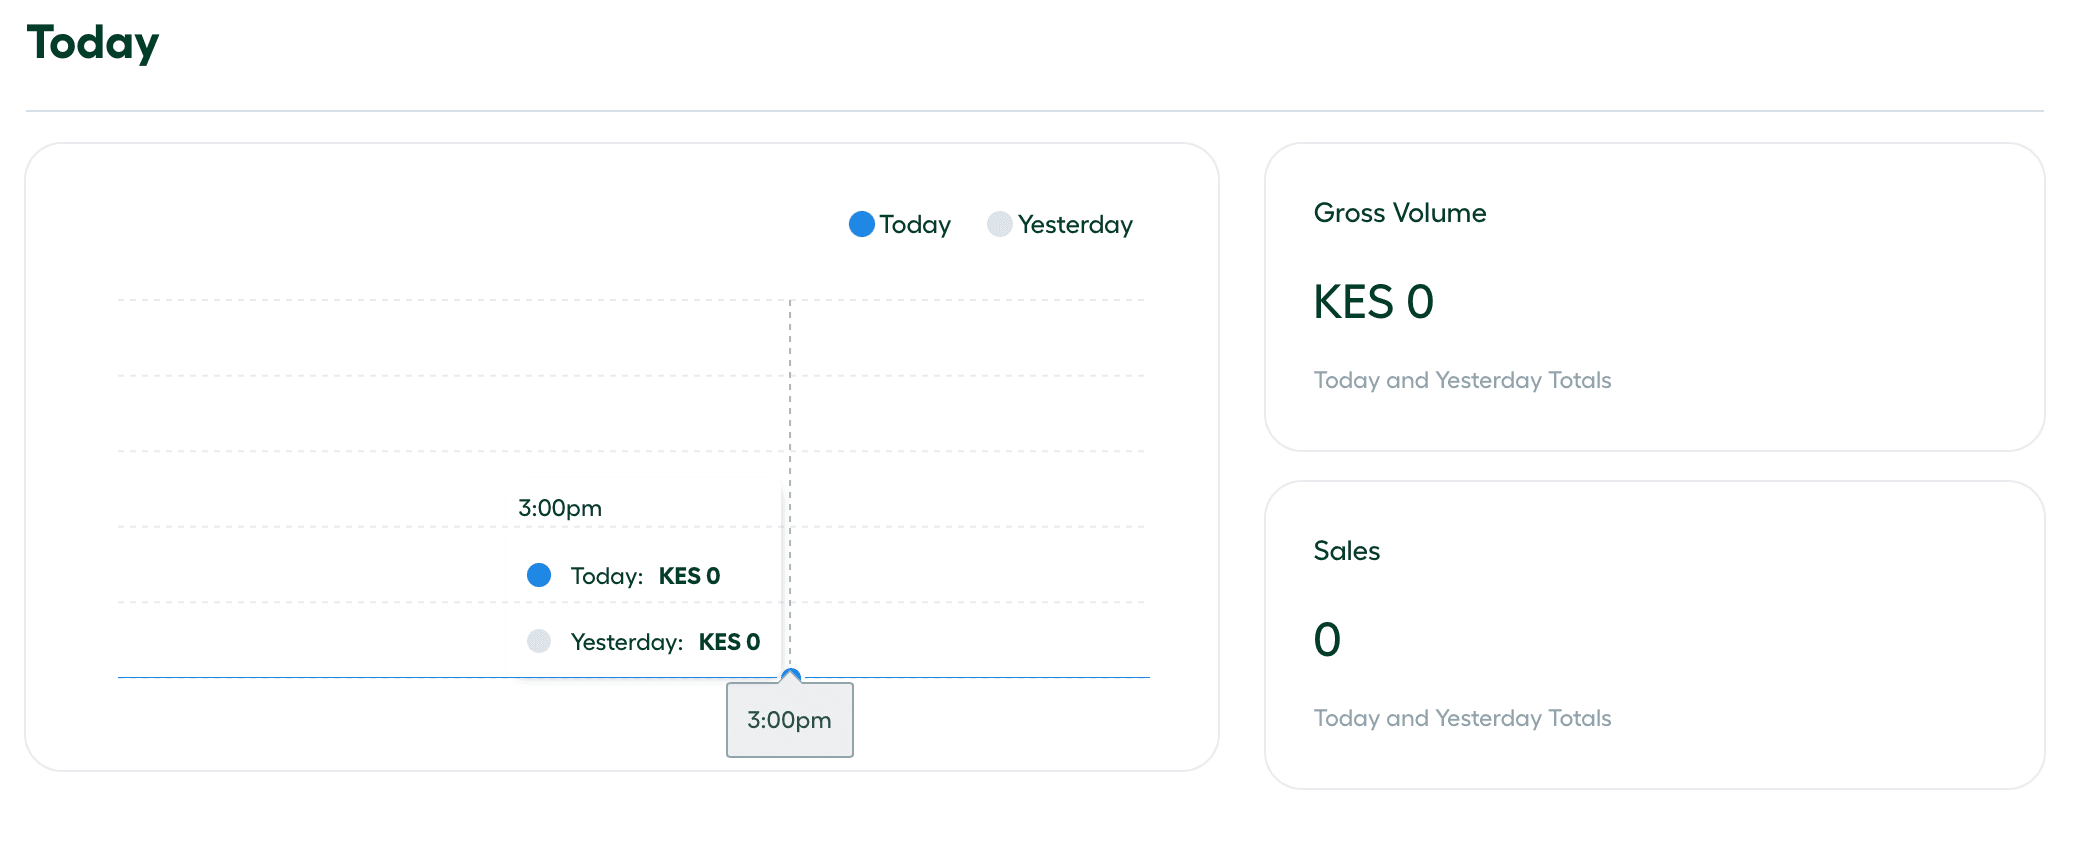
This section focuses on immediate, real-time results for the current 24-hour period.
-
Gross Volume: The total value of all transactions processed today.
-
Total Sales: The count of successful orders completed.
-
Daily Trend Graph: A visual comparison mapping today’s hourly sales against the previous day’s performance.
2. Weekly Overview
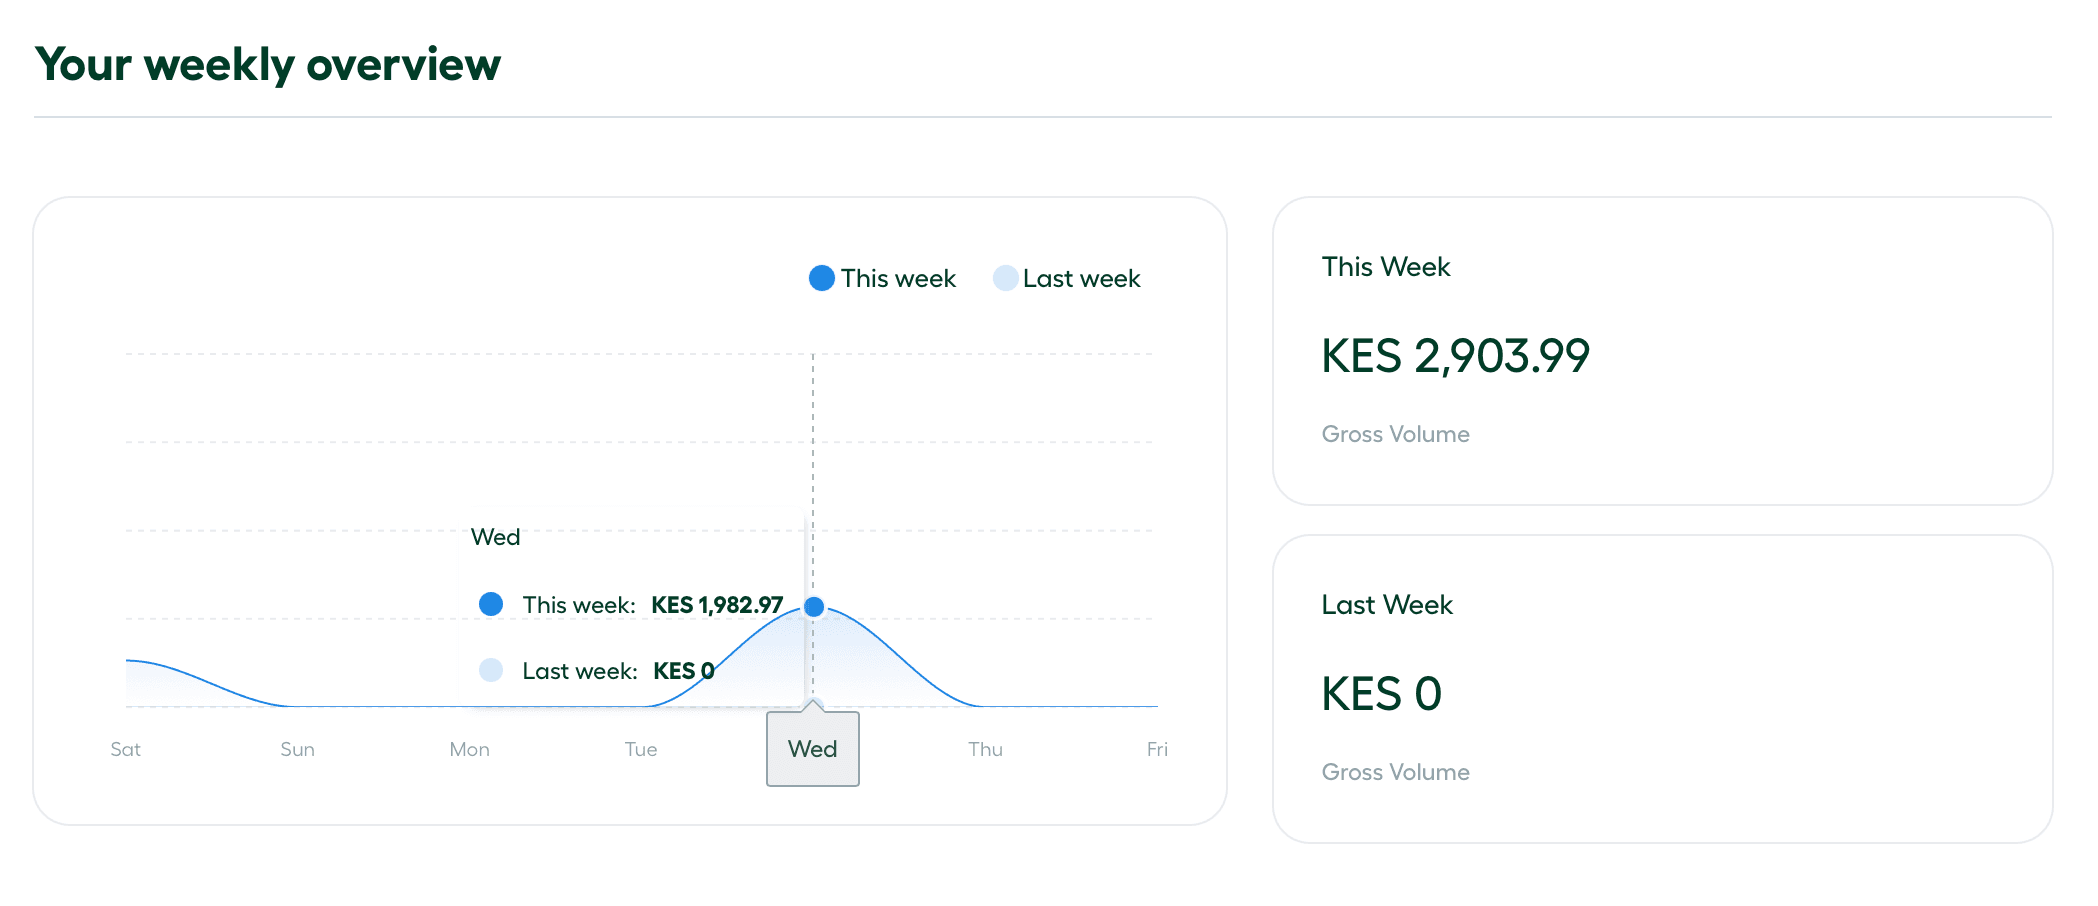
The Weekly Overview provides a broader look at your store’s trajectory, helping you identify mid-term growth or shifts in customer behavior.
-
Current Week Data: Aggregated sales and volume for the last seven days.
-
Historical Comparison: A direct side-by-side view of the current week’s performance against the previous week.
-
Weekly Trend Graph: A visualization that overlays the current week’s daily totals against the previous week’s daily totals.
Understanding the Visuals
Each graph in the Sales Reporting suite uses a color-coded comparative overlay. This allow you to instantly see if your performance is trending above or below your previous benchmarks:
- Dark Blue Line: Represents current period performance (Today or This Week).
- Faint Blue Line: Represents the baseline period (Yesterday or Last Week).
Pro-Tip: Use these comparisons to identify the effectiveness of new in-store layouts or staffing changes. If the Dark Blue Line is consistently trending above the Faint Blue Line, your optimizations are driving measurable growth.