Offers & Collections Reporting
The Offers & Collections report provides a granular view of how your promotions and curated product groups are performing at a specific store location. This dashboard allows you to measure the direct impact of your marketing efforts on customer behavior and total revenue.
Key Performance Indicators (KPIs)
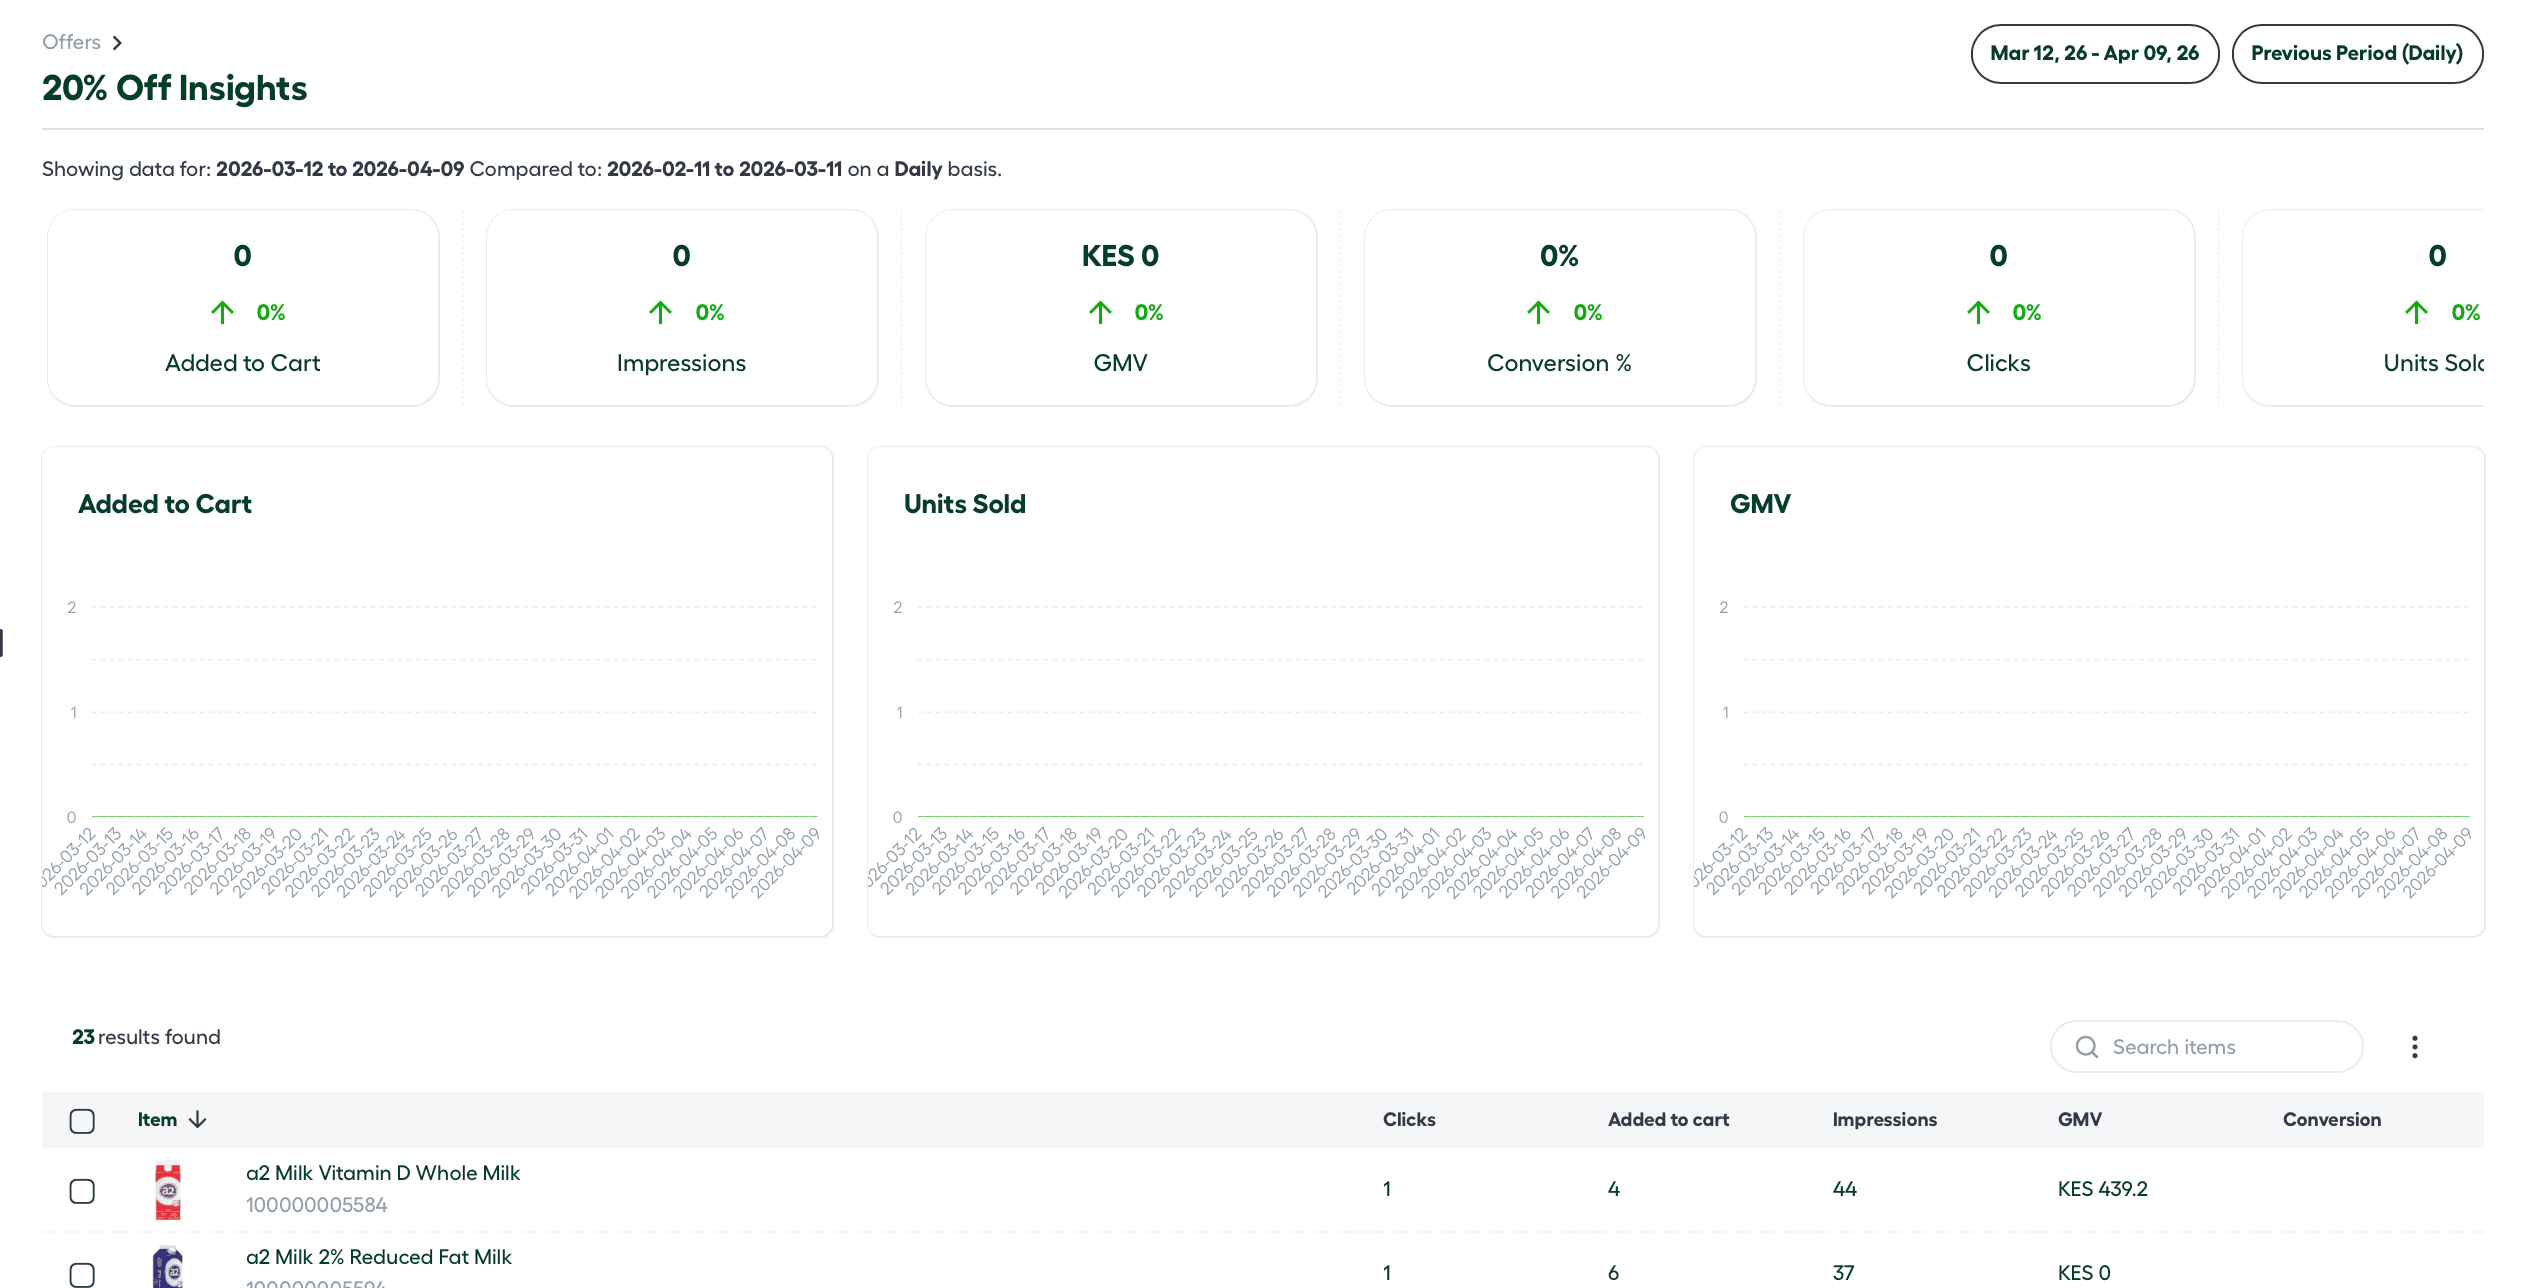
At the top of the dashboard, the platform tracks six critical metrics. Each metric provides a side-by-side comparison between your Selected Period and your Comparison Baseline.
-
Added to Cart: How many times products from the campaign were added to a shopping basket.
-
Impressions: The total number of times the offer or collection was viewed by customers.
-
GMV (Gross Merchandise Value): The total monetary value of all items sold.
-
Conversions (%): The percentage of users who viewed the campaign (Impressions) and went on to complete a purchase.
-
Clicks: The number of direct interactions or “taps” on the promotion.
-
Units Sold: The physical volume of products purchased through the campaign.

Customizing Your Data View
To gain the most accurate insights, you can curate the data representation using the Comparison & Granularity tools.
1. Comparison Ranges
You can select a specific date range for your current data and compare it against:
- Previous Period: Compare current data to the days immediately preceding the selection.
- Previous Year: Compare performance against the same dates from the prior year to account for seasonality.
- Custom Range: Define a specific historical window for unique benchmarking.
2. Series Granularity
Adjust the X-axis of your reports to view trends at different scales:
- Daily: Best for tracking short-term flash sales.
- Weekly: Ideal for standard recurring promotions.
- Monthly: Used for long-term seasonal collections.
Visualizing Trends
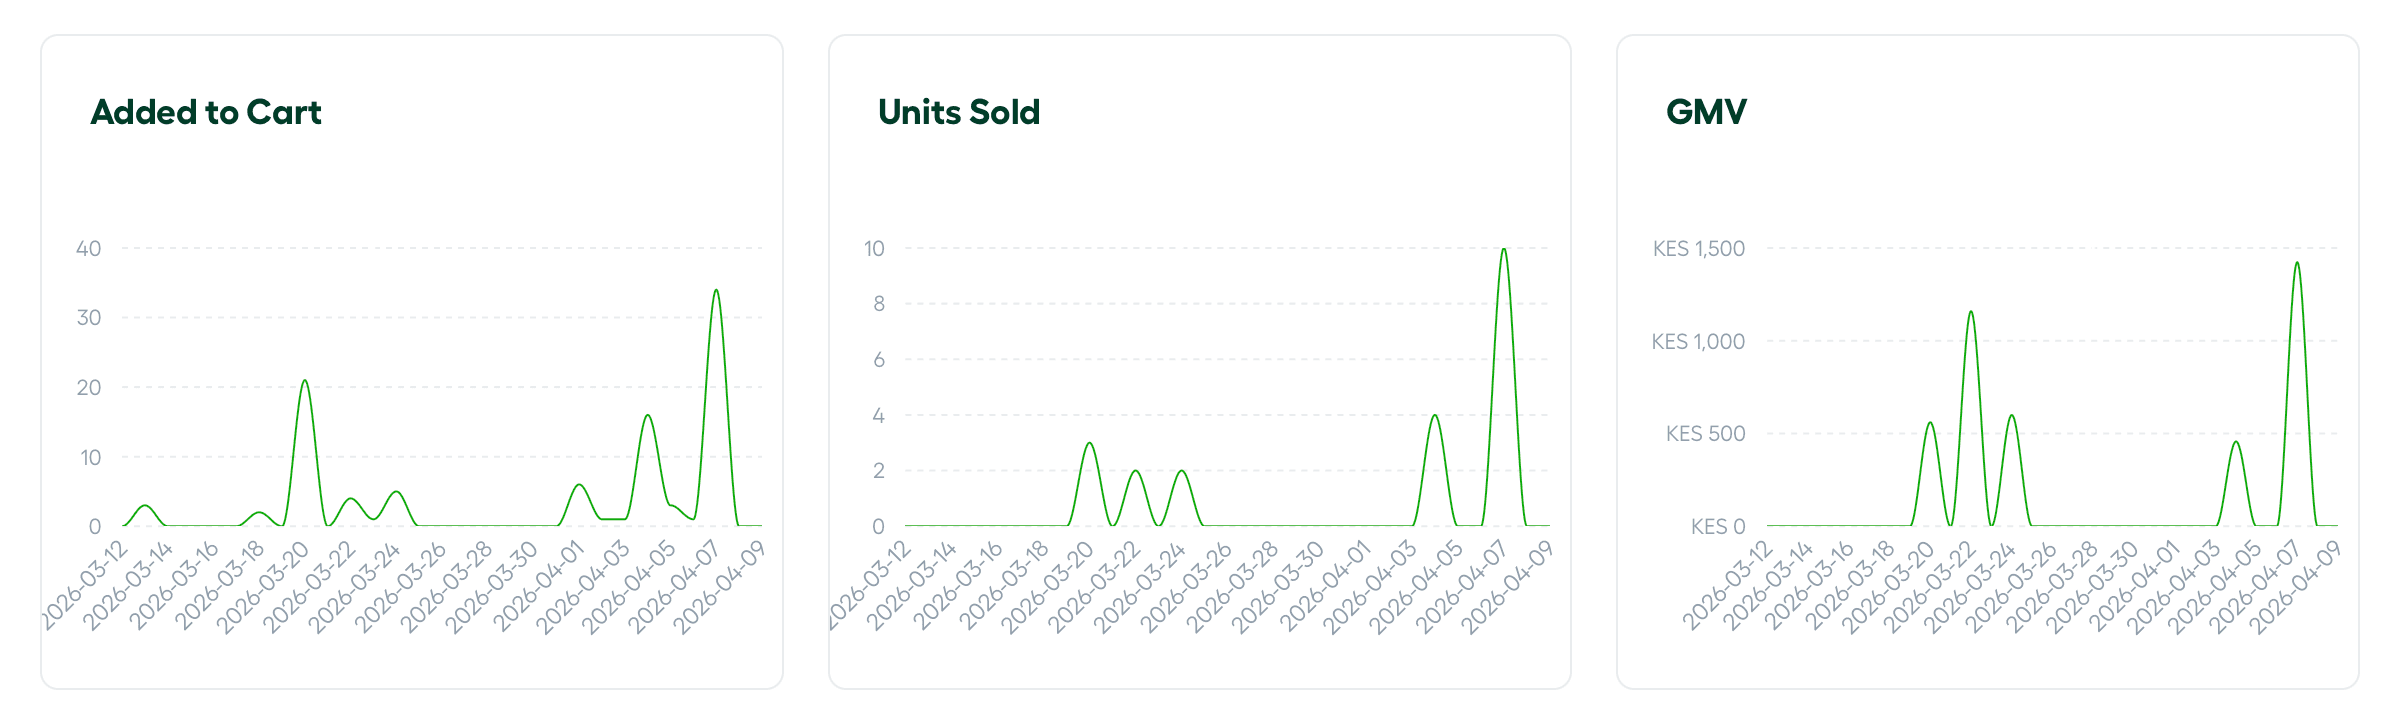
The dashboard features three primary line graphs that use your selected granularity and date range on the X-axis. These graphs help identify peak engagement times during a campaign:
-
Added to Cart Graph
-
Units Sold Graph
-
GMV (Revenue) Graph
Performance Breakdowns
Campaign List View
Below the graphs, you will find a list of all active Offers or Collections. This table provides a high-level numeric overview for each entry, including Clicks, Added to Cart, Impressions, GMV, and Conversions.
Deep-Dive Analysis
Clicking on a specific Offer or Collection opens a Detailed Report Page. This view provides the aforementioned metrics scoped exclusively to that single campaign.
Product-Level Insights
At the bottom of every individual report page, the platform lists the Specific Products contained within that offer or collection. For each product, you can track:
-
Clicks
-
Added to Cart
-
Impressions
-
GMV
-
Conversions